


Flip AI is a contextual intelligence application that cuts through observability noise and gives SREs perspective on complex incidents. From day one, our focus hasn't been on building another dashboard or time-series viewer, it's been on building an intelligence layer that actually understands operational systems. Over the past two years, the industry has talked endlessly about "AI SRE," but very few production-ready agents have actually made it into the hands of on-call engineers. That's why the launch of Datadog Bits AI is an important milestone for this space.
As builders who operate on top of major observability platforms, including Datadog, we pay close attention to every meaningful launch in this space. After two years in beta, the GA release of Bits AI presents an important opportunity to try it not as competitors, but as practitioners where the broader AI SRE landscape actually stands. Our objective is straightforward: examine whether these emerging AI agents can truly debug the complex, tricky, and drawn-out production incidents that drain engineer time and stall entire teams. This isn't about cheerleading or criticism; it's about clarity. And speaking as someone who has spent too many late nights debugging incidents that simply wouldn't die, I think the community deserves a clearer picture of what actually works.
"AI SRE Tools Can Tell You What Happened. The Real Challenge Is Why"
Analysis Framework
A typical AI SRE evaluation would focus on the following main points:
Key Analysis Dimensions
It's a no-brainer that LLMs are faster than humans, so we won't harp on that too much. MTTR/MTTD is a given win if accuracy holds. Hence we'll focus on these main dimensions:
- Incident Complexity
- Accuracy
- Depth of RCA
- Use of MELT Modalities
Instrumentation completeness and telemetry volume are important overall dimensions, but it's difficult to quantify directly, so instead of treating it as its own category, we weave it into the scenarios that are set up to naturally show up. For non-scaled systems, it's worth noting that cloud LLMs like OpenAI and Claude have gotten strong enough that a whole class of incidents no longer requires specialized AI SRE tooling; you can often copy-paste a few logs and get a workable answer. For deeper context on why instrumentation gaps and architectural complexity still make this space challenging, you can refer to a previous post I wrote: https://www.flip.ai/blog/logs-dont-lie-but-traces-can.
Incident Scenarios
We test against two different architecture patterns:
- OTEL astronomy shop app: This is a popular, clean, kubernetes based reference microservices application with mostly request-response patterns and some async processing patterns. [View Architecture]
- Event driven app: This is a homegrown created application for event driven processing using a mix of native AWS services like SQS and event driven pipelines like Kafka with consumers. [View Architecture]
Methodology
To ensure a thorough evaluation that includes reliability, we ran each scenario three times to account for temporal variability in Bits AI's investigations. We then selected the strongest Bits AI result and compared that with Flip AI's debug analysis for that time window.
We ran dozens of investigations using Bits AI and as expected the RCAs from Bits and Flip for simple incidents were both similar and good, but for these incidents we found that engineers would get to RCAs themselves in less than 5 mins too. Hence, as mentioned above we'll focus on a few of the more complex scenarios to truly understand its effectiveness:
- OOM scenario for a downstream service [OTEL astronomy shop app]
- DB Connection storm [OTEL astronomy shop app]
- Network Partition between services [Event Driven app]
- K8s Pod CrashLoopBackoff [Event Driven app]
- Age of Oldest Message in SQS Queue [Event Driven app]
Downstream service crash
We crash the recommendation service by allocating 10MB of memory per get_products request and increasing the total load into the service.
 Bits AI - OOM Analysis
 Flip AI - OOM Analysis
Observation (Bits misses the full RCA, the 5th why)
Bits AI is correctly able to point out the frontend service was failing due downstream service recommendation rejecting connections, however it fails to point out why the connections were being refused. Flip AI on the other hand is able to point to increase in requests causing resource exhaustion at recommendation service and also suggests that checkout and shipping services are experiencing errors due to the same underlying issue. Using the chat, we prompted Bits AI to look for container restarts, and it was able to find logs identifying that a restart had happened but failed to answer why this happened.
DB Connection storm
In this scenario, we disable connection pooling in the accounting service, causing a database connection storm. Each message consumed spawns a new database connection instead of reusing pooled connections. Additionally, idle connections are created when the chaos flag is enabled.
 Bits AI - DB Connection Storm
 Flip AI - DB Connection Storm
Failed Bits Attempts: [View Attempt 1] | [View Attempt 2]
Observation (Bits RCA is good, but not reliable across attempts)
Out of 3 attempts, Bits did not reach conclusive evidence in 1 of them, took a wrong turn in 1 of them, but on one occasion it was able to find the connection storm issue. In the non-conclusive evidence runs, it did surface hypotheses indicating leaked connections, connection storms etc, however its chat answers were misleading when prompted to dive deeper as it called out "No correlation between connection issues and Kafka receive latency". Flip on the other hand is able to find the correct logs and pin point the exact root cause that Postgres database was reaching its maximum connection limit.
Network Partition between services
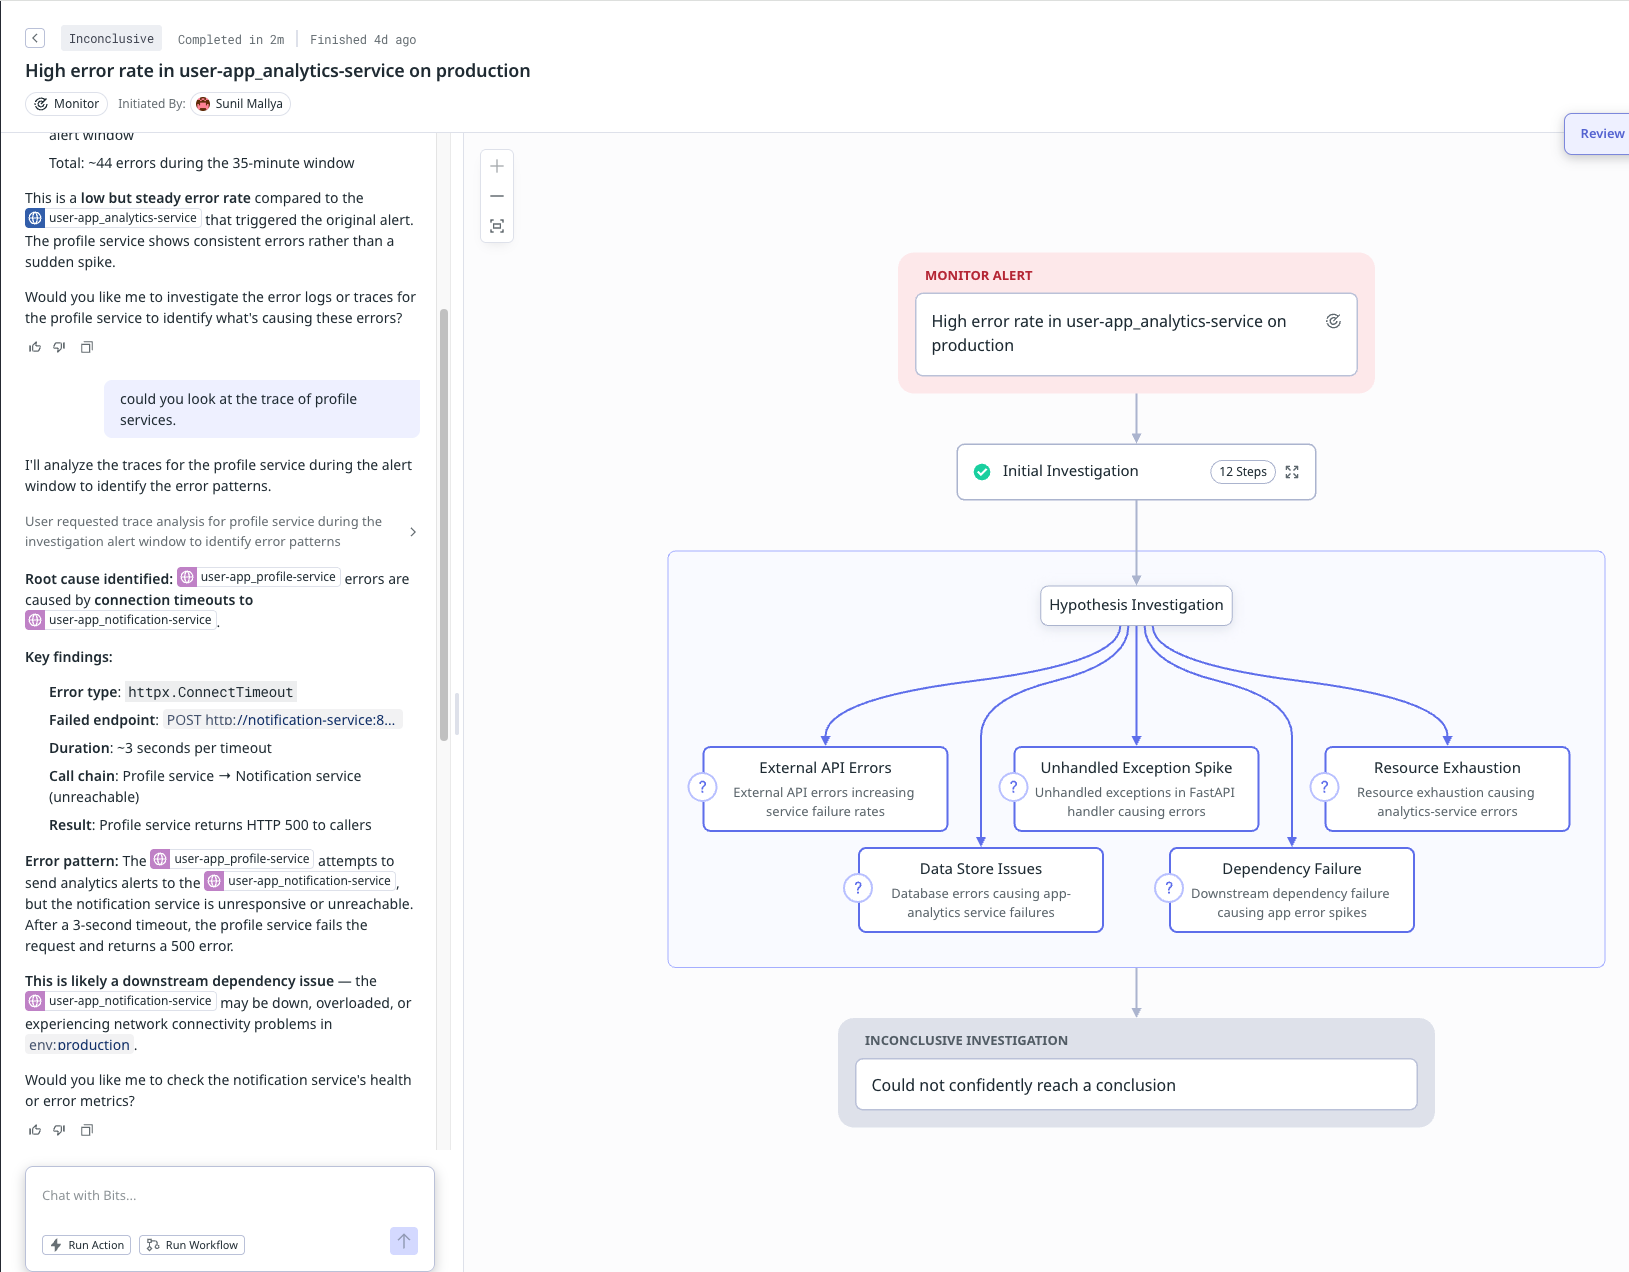
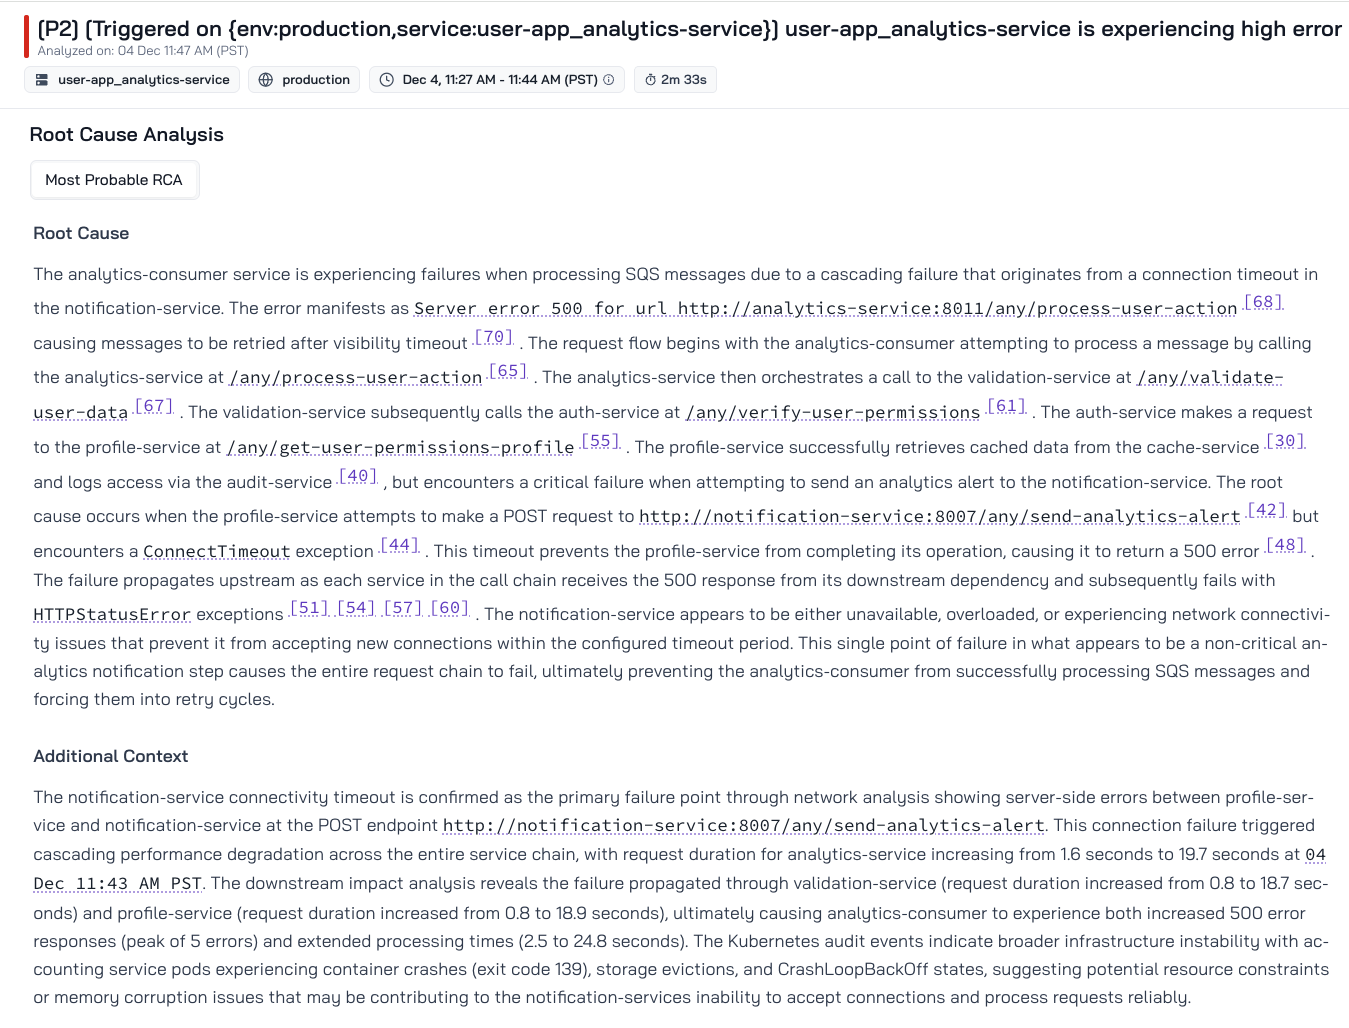
In this scenario, we introduce a network partition between profile-service and notification-service. The profile-service is unable to connect to the notification service.
 Bits AI - Network Partition
 Flip AI - Network Partition
Observations (Bits fails to debug this incident on its own)
Bits produces inconclusive investigation for all the 3 attempts. By guiding the investigation through chat with suggestions to look at particular metrics and traces, it's able to get closer to the root cause, however it still gives the user a plethora of network related causes and not the definitive cause. Flip is able to root cause this effectively and surface metric correlations in the notification service that support its theory on why connection timeouts happen.
K8s Pod CrashLoopBackoff
This scenario deploys a pod using a faulty image (e.g., a pause container), causing the pod to repeatedly restart for a set duration. It simulates a bad deployment where a code bug crashes service pods, leading to service unavailability.
 Bits AI - K8s CrashLoopBackoff
 Flip AI - K8s CrashLoopBackoff
Observation (Bits misses the full RCA, the 5th why)
Bits does a good job of finding the connection-timeout trace and flags upstream impacts, but it doesn't recognize that the timeout happens when the profile service calls the notification service. The evidence is relevant but incomplete, missing the causal chain that leads to the real root cause, i.e the notification service was running a pause container image, causing all downstream calls from the profile service to fail.
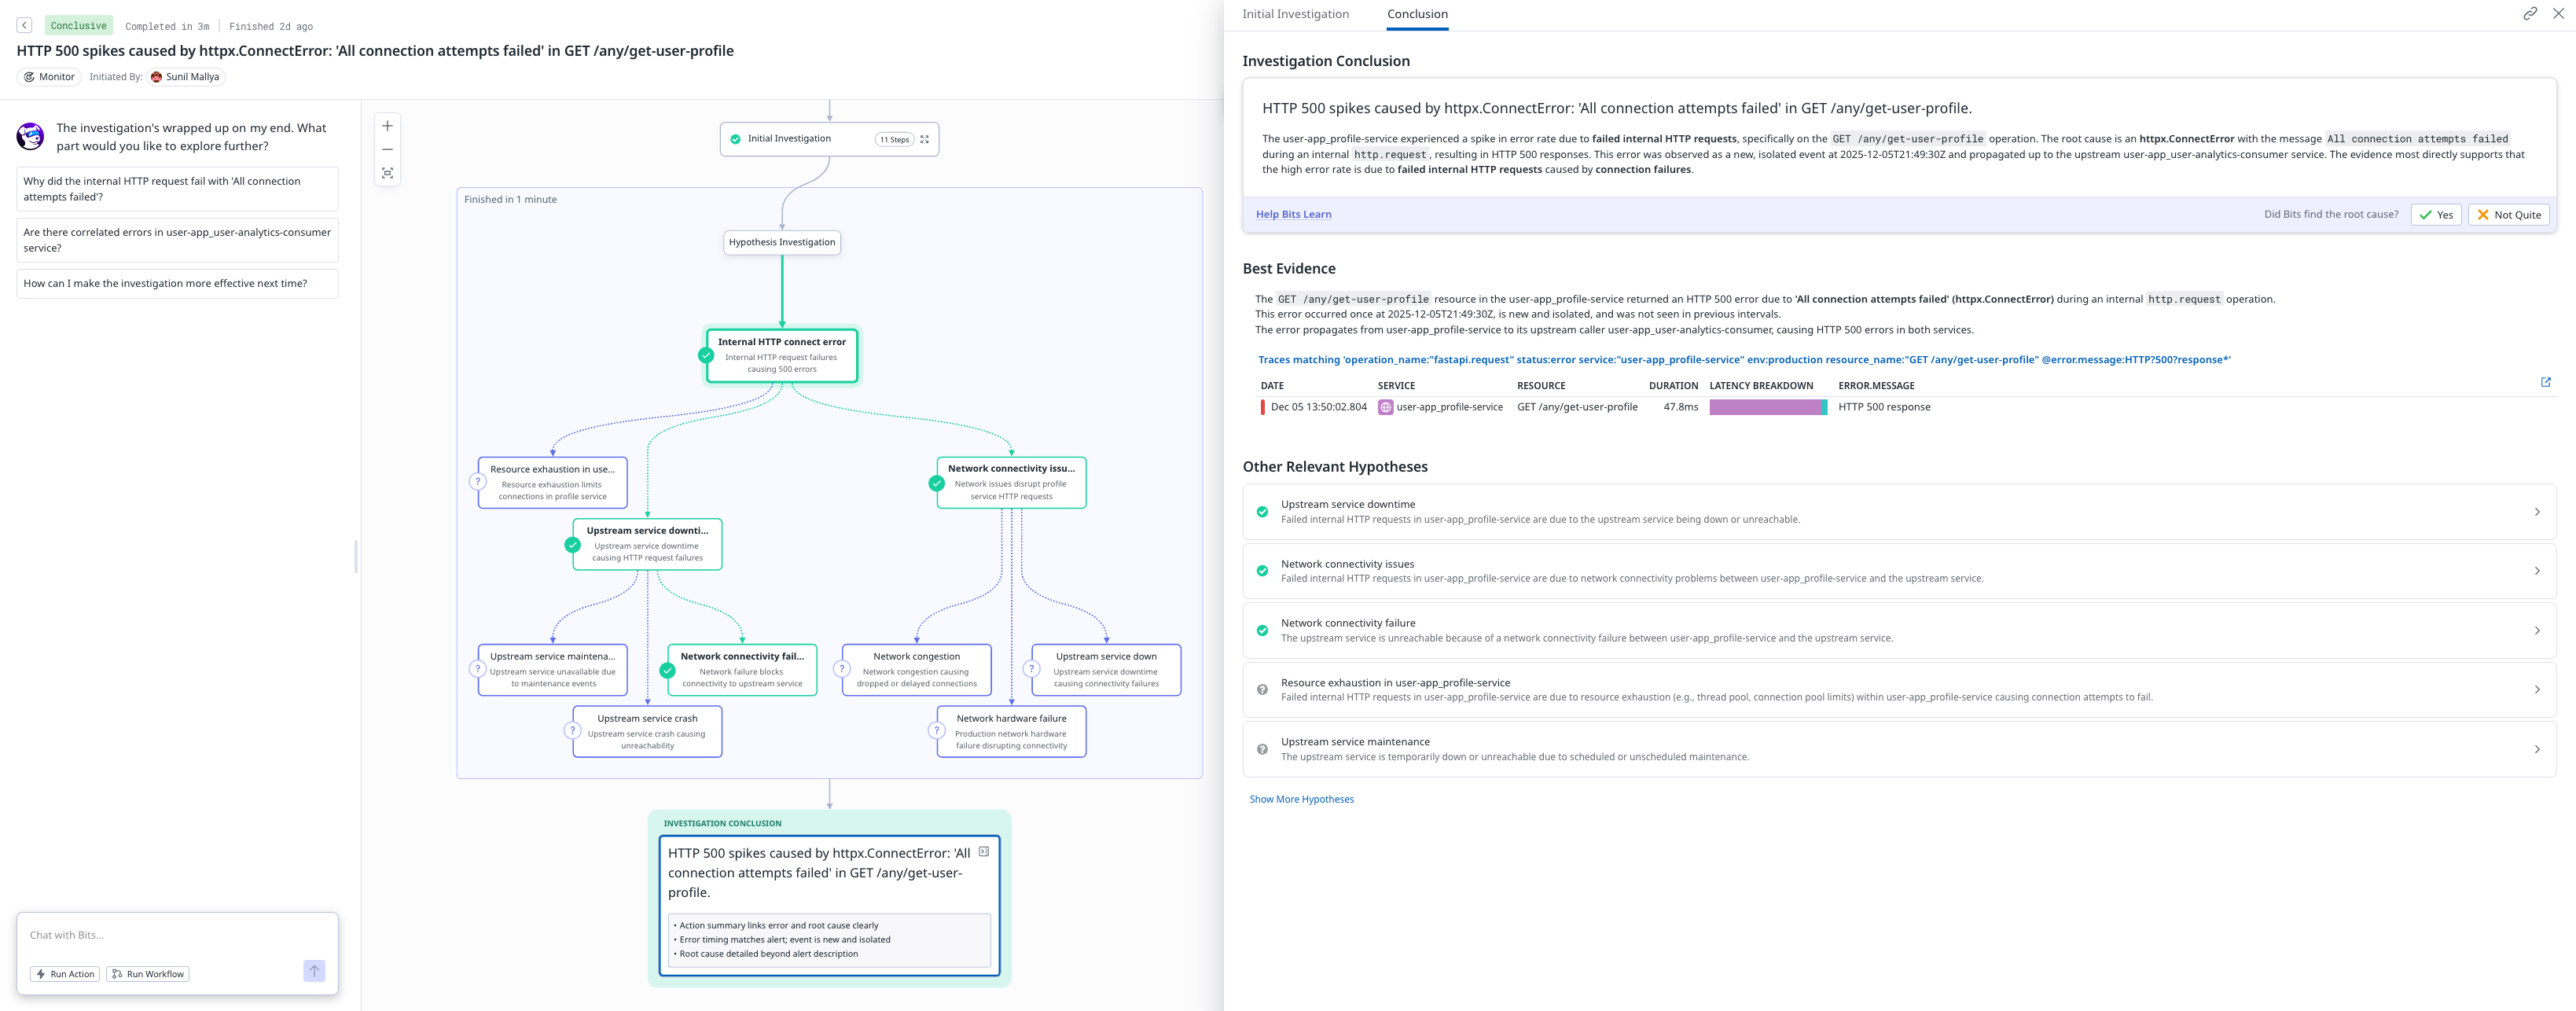
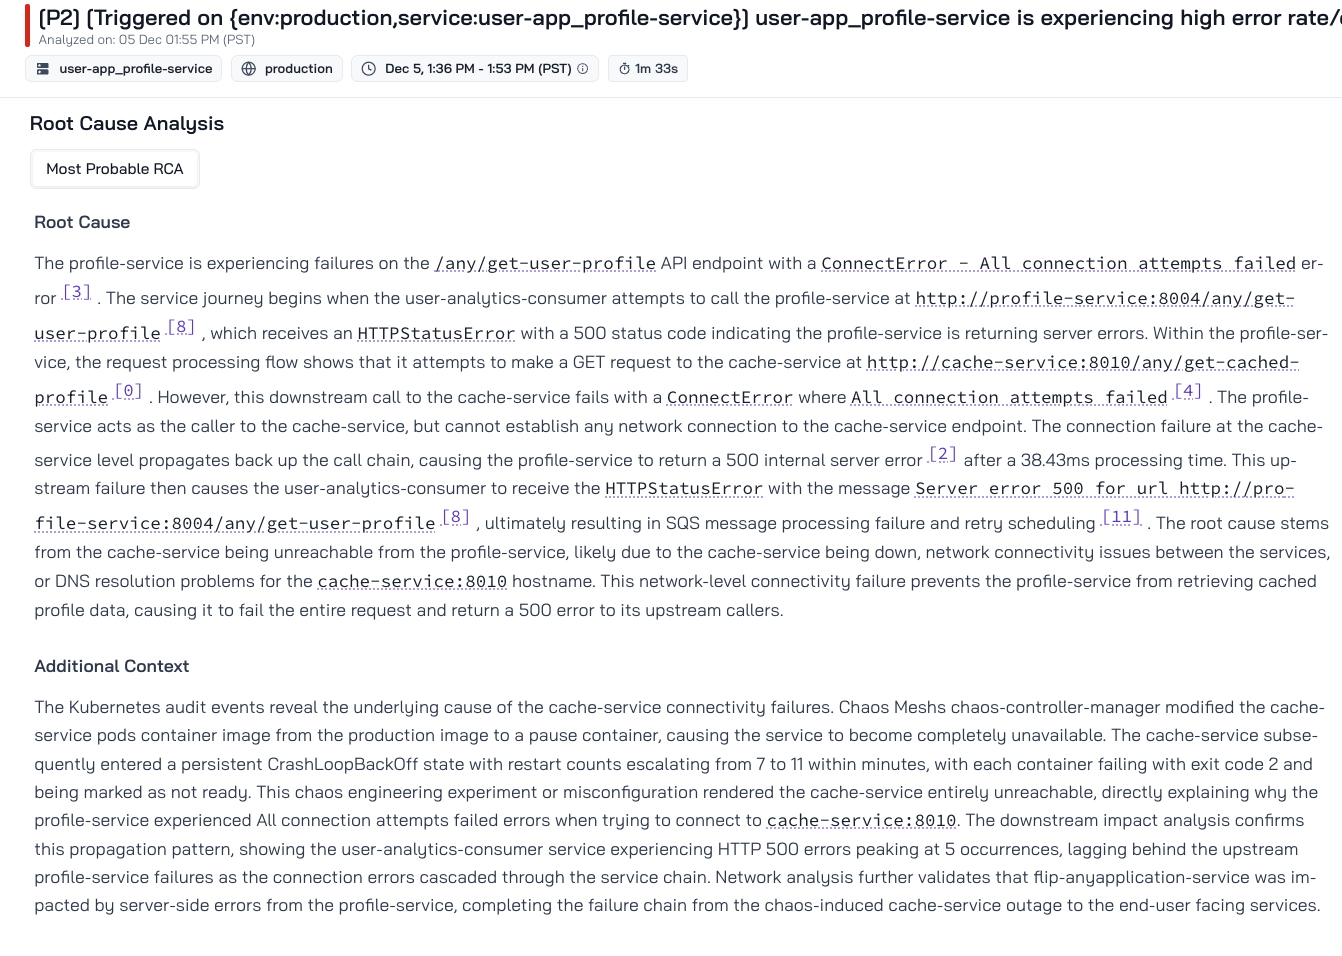
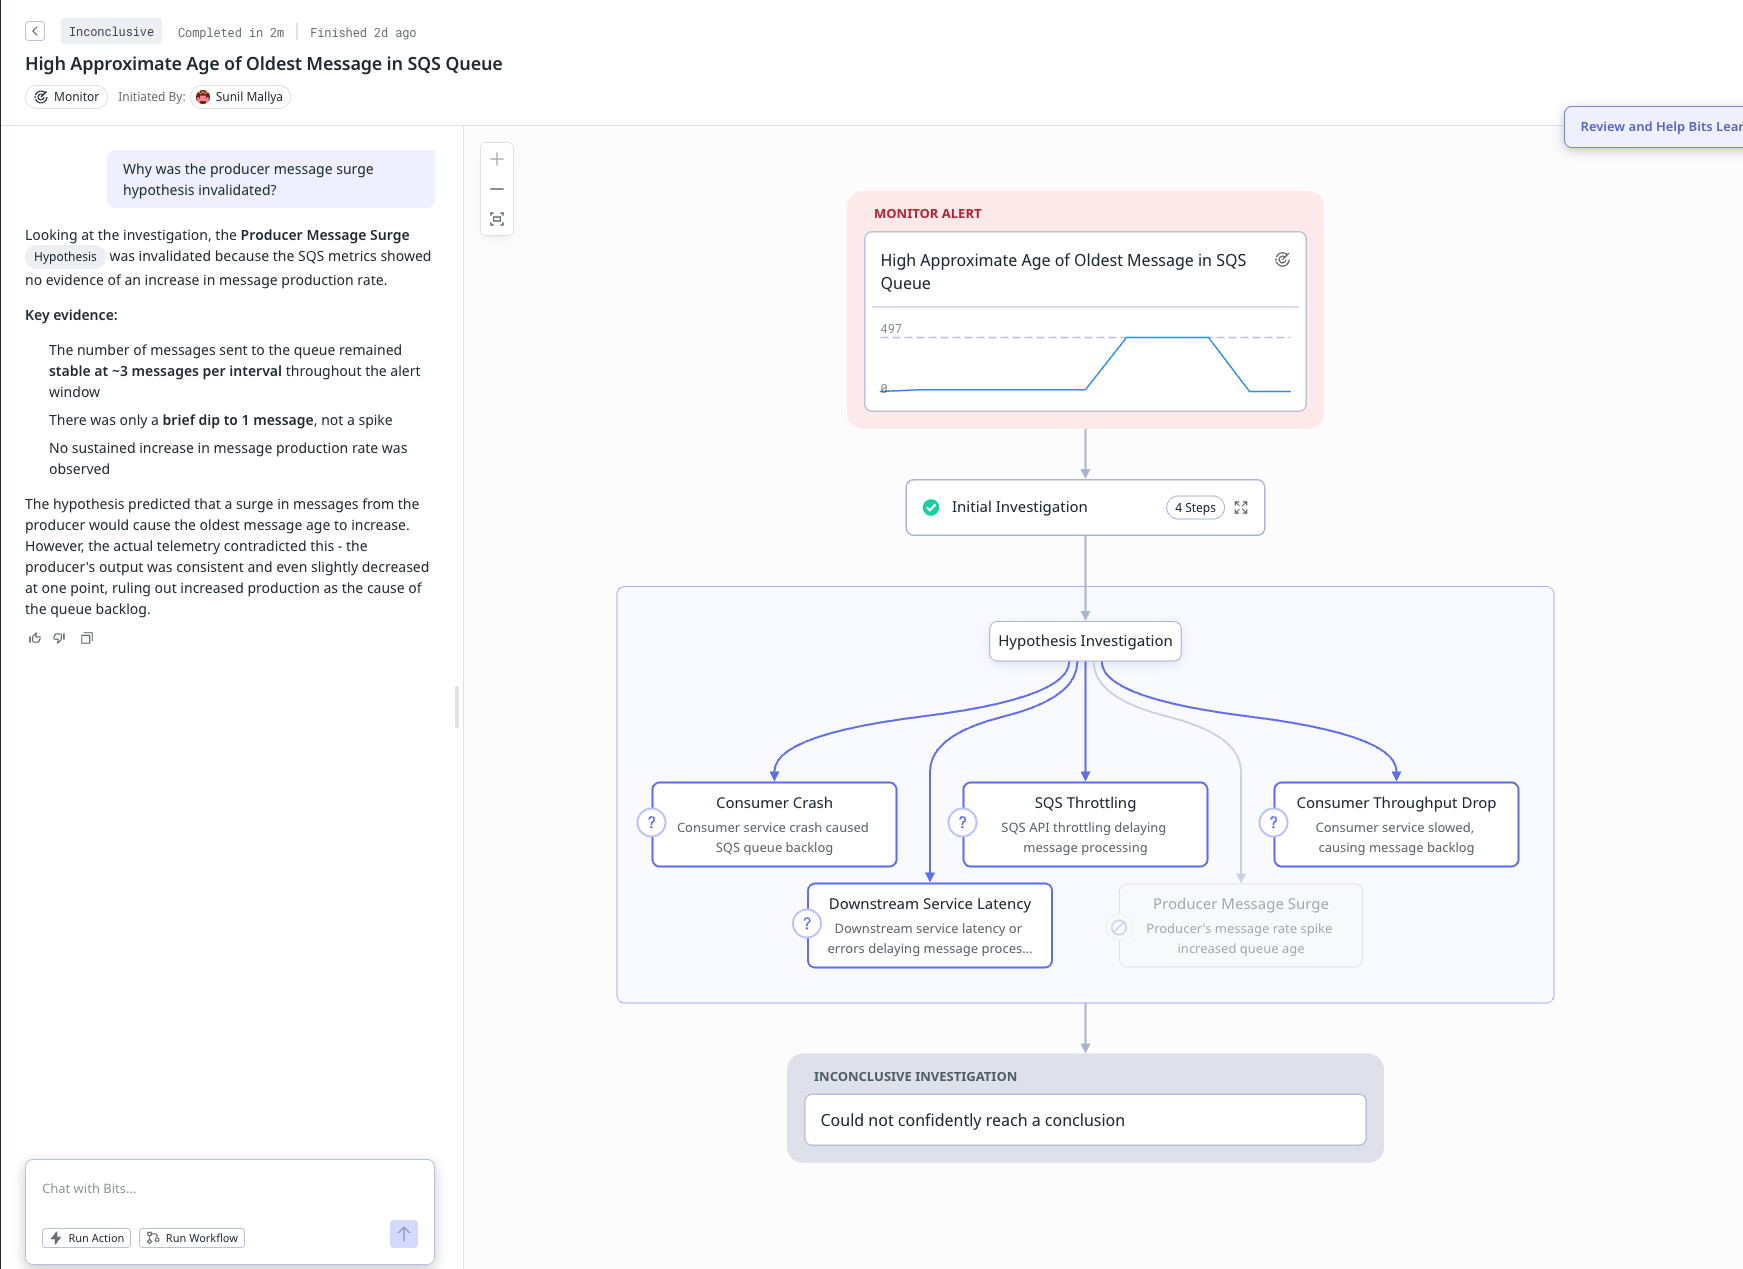
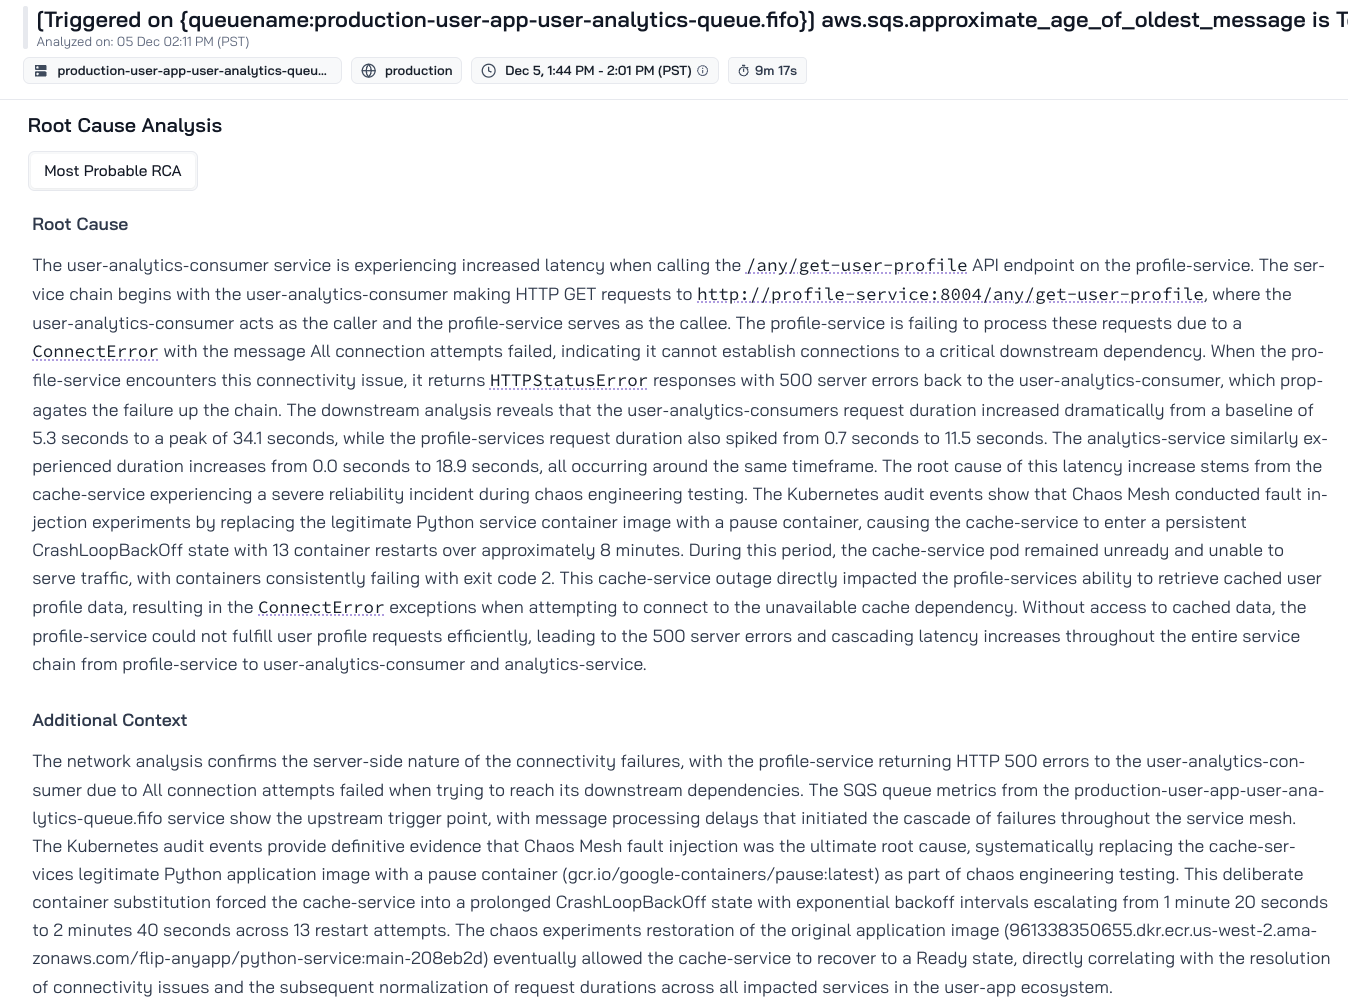
Age of Oldest Message in SQS Queue
This is the same scenario as above (K8s pod crash in event driven app), but we use a different debug point, i.e trigger the investigation at the queue age monitor.
 Bits AI - SQS Queue Age
 Flip AI - SQS Queue Age
Observation (Bits fails to debug this incident, suggestive hints don't help)
Bits produces inconclusive investigation for all the 3 attempts. Providing suggestive evidence didn't help either. On the other hand Flip is able to effectively construct the flow of data for the SQS queue, then detect what's broken and the why. On a funny note, Flip even surfaces the chaos mesh log that injects this error and ties that as the real root cause of the pod crash ;)
Discussion
Before diving into the specifics, it's worth outlining some general patterns we consistently observed while evaluating Bits AI. It appears to us that the debugging flow approaches incidents by anchoring on the primary symptom that's found in logs or traces and then mapping to a collection of known failure patterns. This makes Bits AI effective for straightforward, well-instrumented issues, but it also means the investigation tends to stay close to the initial signal rather than exploring the broader system. We find that Log analysis is often shallow, metric exploration is limited, and multi-modal reasoning across metrics, events, logs, and traces is rare. We even find occasions where service names itself are hallucinated. As incidents become more complex or fall outside conventional patterns, Bits AI's workflow increasingly relies on human guidance, and the RCA often centers on symptoms rather than deeper causes. Bits seems to halt the investigation and marks it as inconclusive when evidence is sparse, which is reasonable from a safety perspective, but still annoying when you're the one trying to debug a live system.
Incident Complexity
Bits AI reflects the natural evolution of observability platforms: begin with the primary symptom, usually the top error in logs or traces and generate hypotheses based on known patterns. This works for straightforward failures but can struggle in modern architectures where issues cascade across microservices, queues, databases, third-party APIs, and ETL pipelines. Bits AI's investigations tend to focus on a single component, which limits its ability to reason about cross-system interactions or under-instrumented services. Flip AI was designed for these messy, multi-hop environments. Instead of anchoring on a symptom, Flip evaluates the entire telemetry surface and reconstructs how components influence one another, enabling it to handle incidents that spread across several layers of the stack.
Accuracy
Because Bits AI seems to rely on pre-canned hypotheses tied to common failure modes, it is strong at identifying likely suspects but can miss alternative or less typical causes. Its top-down approach, i.e. symptom → pattern → validation, prioritizes recall but sometimes sacrifices precision, especially when logs or metrics send mixed signals. Flip AI takes a different path: a bottoms-up investigation that considers all available evidence before forming any conclusion. If a queue's message age rises, for instance, Flip examines upstream load, downstream processing latency, database pressure, error bursts, and event timelines to reconstruct the true causal chain. This approach yields materially higher precision, especially in ambiguous or high-cardinality environments.
Depth of RCA
One consistent pattern in our analysis is that Bits AI is effective at describing what happened but often stops short of explaining why it happened. The fourth and fifth "why" that explore deeper causal layers are frequently where its investigation plateaus. The model does well on symptoms but can struggle to trace the underlying drivers that triggered them. Flip AI is designed specifically to push into these deeper layers. By correlating signals across services and time windows, Flip produces RCAs that span multiple hops, such as: Frontend service under pressure → downstream service has latency issues → dependency service memory increases → container OOMs and restarts, amplifying the incident. This ability to build multi-step causal chains is the core of Flip's differentiation and the reason it performs reliably on incidents that take human teams hours to untangle.
Use of MELT Modalities
Bits AI does incorporate logs and traces into its workflow, but its exploration is often shallow; logs may be scanned for key error patterns, and metrics are typically referenced only when directly aligned with the initial hypothesis. When the evidence was deep inside logs, we often found Bits AI struggles and reached dead ends. Flip AI was built from the ground up as a multi-modal inference engine. This is why Flip can still assemble causal chains even when trace IDs are missing or fragmented while leaning on logs and metrics to infer the relationships that traces failed to capture (a challenge we've written about before). By correlating signals across modalities rather than treating them separately, Flip uncovers causal paths that only emerge when everything is considered together, not in isolation.
Conclusion
For simple incidents, BITS AI will usually give you a decent answer. But enterprise systems are noisy, unpredictable, and almost never fail the same way twice and that's where BITS stops being useful. Flip was built for the real world; the messy environments, the partial data, the failures that don't fit a template. We were in the same place as BITS back in 2024, and we outgrew that ceiling fast. Flip was built to go after the messy, multi-modal incidents AI SREs out there can't reach. If you want an AI that keeps up when reality breaks production, come and Get started with Flip in less than 5 minutes.

