Logs Don't Lie, But Traces Can

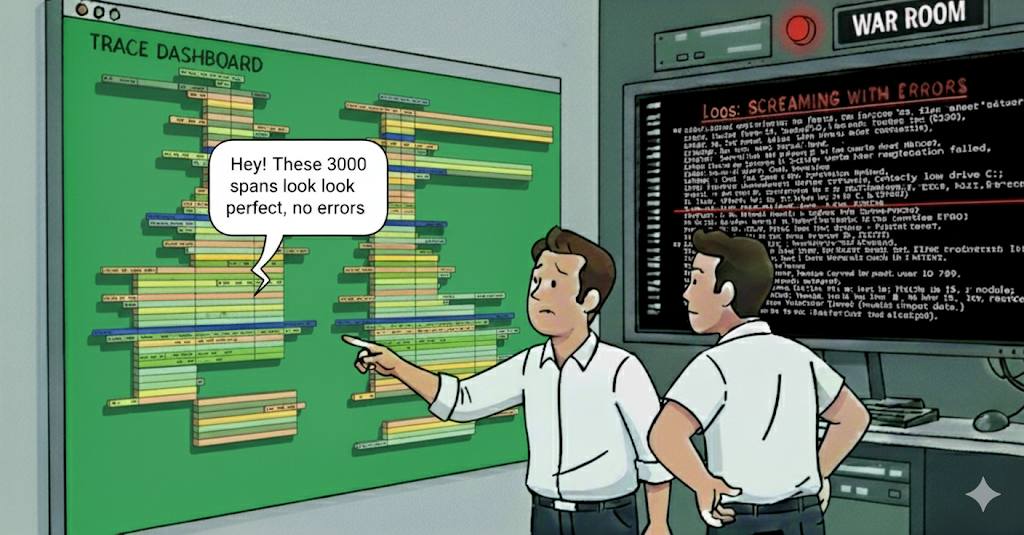
Slack pings light up, dashboards turn red. Errors are climbing, latency is spiking. You pull up the APM tool and look for “the” trace, expecting a clear answer, but all you see are thousands of spans that look perfectly normal. You scroll, filter, expand a few nodes, nothing jumps out. Meanwhile, it’s clear from the metrics that users are still hitting errors. Out of options, you turn to the logs. It isn’t easy there either — pages of noise, stack traces for unrelated errors, timestamps dancing out of sync. You grep, pivot, and piece things together line by line until finally, buried deep, it stares back at you: a downstream service silently failing in a way the trace never recorded. The trace painted a perfect story that wasn’t real. The instrumentation missed it, the pretty trace UI told a half-truth, but the logs had the truth. And that’s the cruel lesson every seasoned engineer learns: logs don’t lie, but traces can.
In this post, we'll dive deep into why logs are considered the reliable source of truth for debugging, and how traces (and by extension some APM tools) can hold back the truth and show incomplete information in complex systems. Let's explore why seasoned developers, SREs (and Flip AI) still turn to logs when the going gets tough, and why you might start questioning an over-reliance on tracing for those gnarly debugging scenarios.
Logs: The Ultimate Source of Truth in Debugging
Every seasoned SRE has learned to trust logs, because they’re the easiest, lowest-risk way to capture what’s happening inside a system. Adding a log line is trivial in any language; no agents, no tracing frameworks, no fragile context propagation. A logger.info() or console.error() has negligible performance overhead, so you can sprinkle them freely without worrying about taking the system down. Unlike traces, logs aren’t sampled or stitched together by external infrastructure; they’re written directly by the code that’s actually running. That makes them simple, reliable, and hard to get wrong. When something fails, you can trust the log entry will be there because the application itself emitted it.
Logs are also the most natural signal for developers and SREs to consume. You don’t need a trace ID or a special UI to start investigating, you can grep through a file, query them in your log aggregator, or pivot on anything from an error code to a user ID. Developers decide what goes into the log: a stack trace, a request payload, or a correlation ID. That freedom means the details you need to debug the “why” behind a failure that are often already captured. Traces may tell you that a call failed; logs will show you the exact exception and parameters that triggered it. This directness is why, no matter how fancy your APM or tracing setup is, incidents almost always end with someone scrolling through logs. Messy, noisy, imperfect — but the most trustworthy account of what really happened.
Why logs work so well:
- Easy to Add, Low Overhead: One line of code, universally supported, with almost no performance penalty.
- Always On: Logs capture every event you choose, not a sampled subset.
- Straight From the Source: Emitted inline with the running code, not reconstructed later.
- Developer-Friendly: Searchable with free-form text, flexible to whatever context you add.
Of course, logs aren’t perfect. The same flexibility that makes them useful can also make them chaotic. Different teams log in different formats; some structured JSON, others plain text, others with inconsistent field names which makes aggregation and analysis painful. During incidents, you often drown in noise: repetitive health-check logs, debug spam left enabled, or stack traces from unrelated errors that bury the one you actually care about. On the flip side, critical context can be missing because a developer forgot to log the request ID or input payload. In large systems, volume itself becomes the enemy: terabytes of logs piling up daily, slow queries in your log management tool, and eye-watering storage bills. During an outage, combing through millions of lines can feel like digging through a landfill in search of a single error. And that landfill doesn’t just slow you down; instead, it buries the bigger picture, leading you to miss the overall perspective. Relationships between services get lost, timelines blur, and the signal you need to see in context is scattered across fragments. Logs still hold the truth, but they can make it painfully difficult to see the story behind it.
Logs tell the truth, but sometimes they make you dig through a landfill to find it.
Traces: Powerful but Not Infallible
Distributed tracing promises something magical: a full end-to-end map of a request as it weaves through your services. In theory, you get every call, every timing, every failure chained together under one trace ID. With perfect instrumentation, the picture is elegant — Service A calls Service B, which queries Database C, and you can instantly see where latency builds or where an error originates. That’s why tracing has become one of the three pillars of observability: it can show relationships and concurrency that logs alone can’t.
But reality rarely matches the brochure. Traces depend on everything going right: every service has to be instrumented, context headers must be propagated across hops, agents have to export spans reliably, and you usually can’t afford to capture them all — so sampling kicks in. Miss just one of those steps and the trace becomes misleading. A missing span makes it look like a service was never called. A proxy that drops headers splits one transaction into two unrelated traces. A language without solid auto-instrumentation (C/C++, Go and Rust) leaves whole parts of your system invisible. Asynchronous work like message queues or background jobs often shows up as disjointed traces unless you’ve gone out of your way to stitch them together.
Even when the plumbing works, practical limits creep in. Sampling means the exact failing request might never be captured. Agents under pressure drop spans. Backends silently truncate traces that explode past 10,000 spans. And when instrumentation itself misbehaves from mis-tagging spans to chewing memory, teams turn tracing off just to keep the system alive. The net effect is the same: the trace UI presents a story that looks complete, but it isn’t. Traces are approximations assembled by infrastructure; logs are the raw words of the code itself. That gap is why seasoned engineers treat tracing as a guide, not gospel.
Common pitfalls of tracing in the real world:
- Gaps in Instrumentation: Entire services or code paths missing because no spans were emitted.
- Limited Auto-Instrumentation: Languages like Go, Rust, or custom frameworks often require heavy manual work.
- Asynchronous & Non-HTTP Flows: Queues, schedulers, and background jobs break the trace chain unless stitched manually.
- Broken Header Propagation: Proxies, load balancers, or gateways that don’t forward trace context, splitting or truncating traces.
- Incompatible Context Standards: Old libraries using B3 or proprietary headers that don’t merge into W3C Trace Context.
- Sampling Blind Spots: The failing request may never be traced at all.
- Span/Trace Limits: Agents and backends cap the number of spans, silently dropping parts of the transaction.
- Agent Failures: Export queues overflow, spans are dropped, or buggy instrumentation degrades the application itself.
In real life, traces often end up as the “middle stop” in an investigation rather than the destination. A team gets paged, checks the metrics to confirm the blast radius, and then pulls up a trace to see which service looks suspicious. But the moment things don’t line up — the spans look clean, the timings look normal, or the error isn’t clearly surfaced — engineers instinctively fall back to logs. Traces are good for narrowing the haystack, but they rarely give the needle. That’s why, in most war-room retros, traces are remembered as something people glanced at on the way to the logs, not the tool that solved the issue.
As an SRE, it’s almost an initiation ceremony to hit that moment when a trace leads you astray. I’m yet to meet an SRE who hasn’t seen the request showing HTTP 500 code, but the trace gave no clue about why. The real cause was buried in the logs: a NullPointerException in when it tried to parse a malformed payload.
Take another common scenario that we encountered in one of our customers. They were running a queue-driven pipeline and ran into the same problem. The trace ended cleanly at message publish, making it look like the transaction ended cleanly, while the consumer logs revealed jobs stacking up and failing silently. At another large enterprise we deployed recently, we found that in a microservice behind a proxy, missing header propagation splits a single request into two traces, creating the illusion that the downstream service was never called, until its logs show the real failure. In each case, the trace pointed engineers in the right direction, but it was the logs that delivered the truth needed to actually fix the problem. Use traces as a guide, but always let logs be the final word — trust your logs, and verify your traces.
Enter Flip: Trust logs and include traces to enhance perspective
This is exactly where Flip AI steps in: by combining the raw fidelity of logs with the high-level context of traces, it removes the grunt work SREs and developers face during incidents. Flip ingests both signals, normalizes noisy logs into structured, queryable events, and automatically stitches them back to the trace context that might otherwise be missing or broken. Instead of scrolling through thousands of spans or grepping endless log lines, engineers get a unified, AI-curated investigation trail — the clarity of “what really happened” without the painful forensics. Flip AI turns the messy truth of logs and the partial story of traces into a single, reliable source of insight. See Flip in Action.
Read next
%2520(1).jpeg)
.png)
Ready to See What Flip Can Do?
